
Debugging Node.js Lambdas with SAM local and VSCode


If you've ever tried to debug a Lambda that isn't working correctly then you'll know the pain of adding console.log()'s all over the code, deploying, invoking, waiting for logs to appear in CloudWatch Logs then rinsing and repeating many times over a potentially large amount of time until you finally have your code working. It should be this way and it doesn't need to be.
SAM CLI includes the ability invoke and debug AWS Lambda's locally. With an IDE like VS Code you can set breakpoints in your source, run the code until hits those, view variable values and generally resolve problems much faster.
To start you'll need a SAM project. I created one using the sam init command.
sam init -r nodejs8.10 -n hello
Change into the projects root folder (hello) and check that you can invoke the Lambda locally using:
sam local invoke -e event.json HelloWorldFunction
If everything worked correctly you will see the output from the Lambda.
Fetching lambci/lambda:nodejs8.10 Docker container image......
2019-06-09 19:29:25 Mounting /Users/rich/Documents/github/js-test/hello-world as /var/task:ro,delegated inside runtime container
START RequestId: 1e9988da-d4fb-12e5-c9bb-7f8d3c59860c Version: $LATEST
END RequestId: 1e9988da-d4fb-12e5-c9bb-7f8d3c59860c
REPORT RequestId: 1e9988da-d4fb-12e5-c9bb-7f8d3c59860c  Duration: 5.91 ms       Billed Duration: 100 ms Memory Size: 128 MB     Max Memory Used: 31 MB

{"statusCode":200,"body":"{\"message\":\"hello world\"}"}
Next start the Lambda in debug mode by adding the -d 5858 to the invoke command. This time it will wait for a debugger to connect.
sam local invoke -e event.json -d 5858 HelloWorldFunction
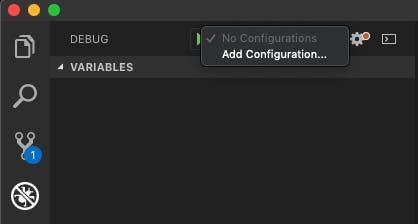
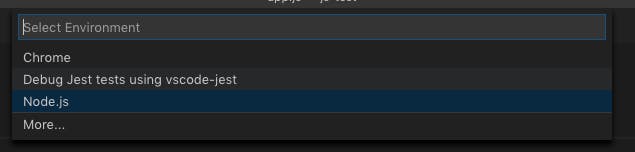
Start VSCode if it's not already running. Open the project so the workspace root for VS Code is the projects root folder. Switch to debugging mode and create a new debug configuration for Node.js
Then paste the following configuration. If your Lambda is located in a folder other than hello-world you'll need to adjust it appropriately.
{
  "version": "0.2.0",
  "configurations": [
    {
      "name": "Attach to SAM CLI",
      "type": "node",
      "request": "attach",
      "address": "localhost",
      "port": 5858,
      "localRoot": "${workspaceRoot}/hello-world",
      "remoteRoot": "/var/task",
      "protocol": "inspector",
      "stopOnEntry": false
    }
  ]
}
This creates a file called .vscode/launch.json with the debug configuration information.
You can now launch the debugger inside VS Code.
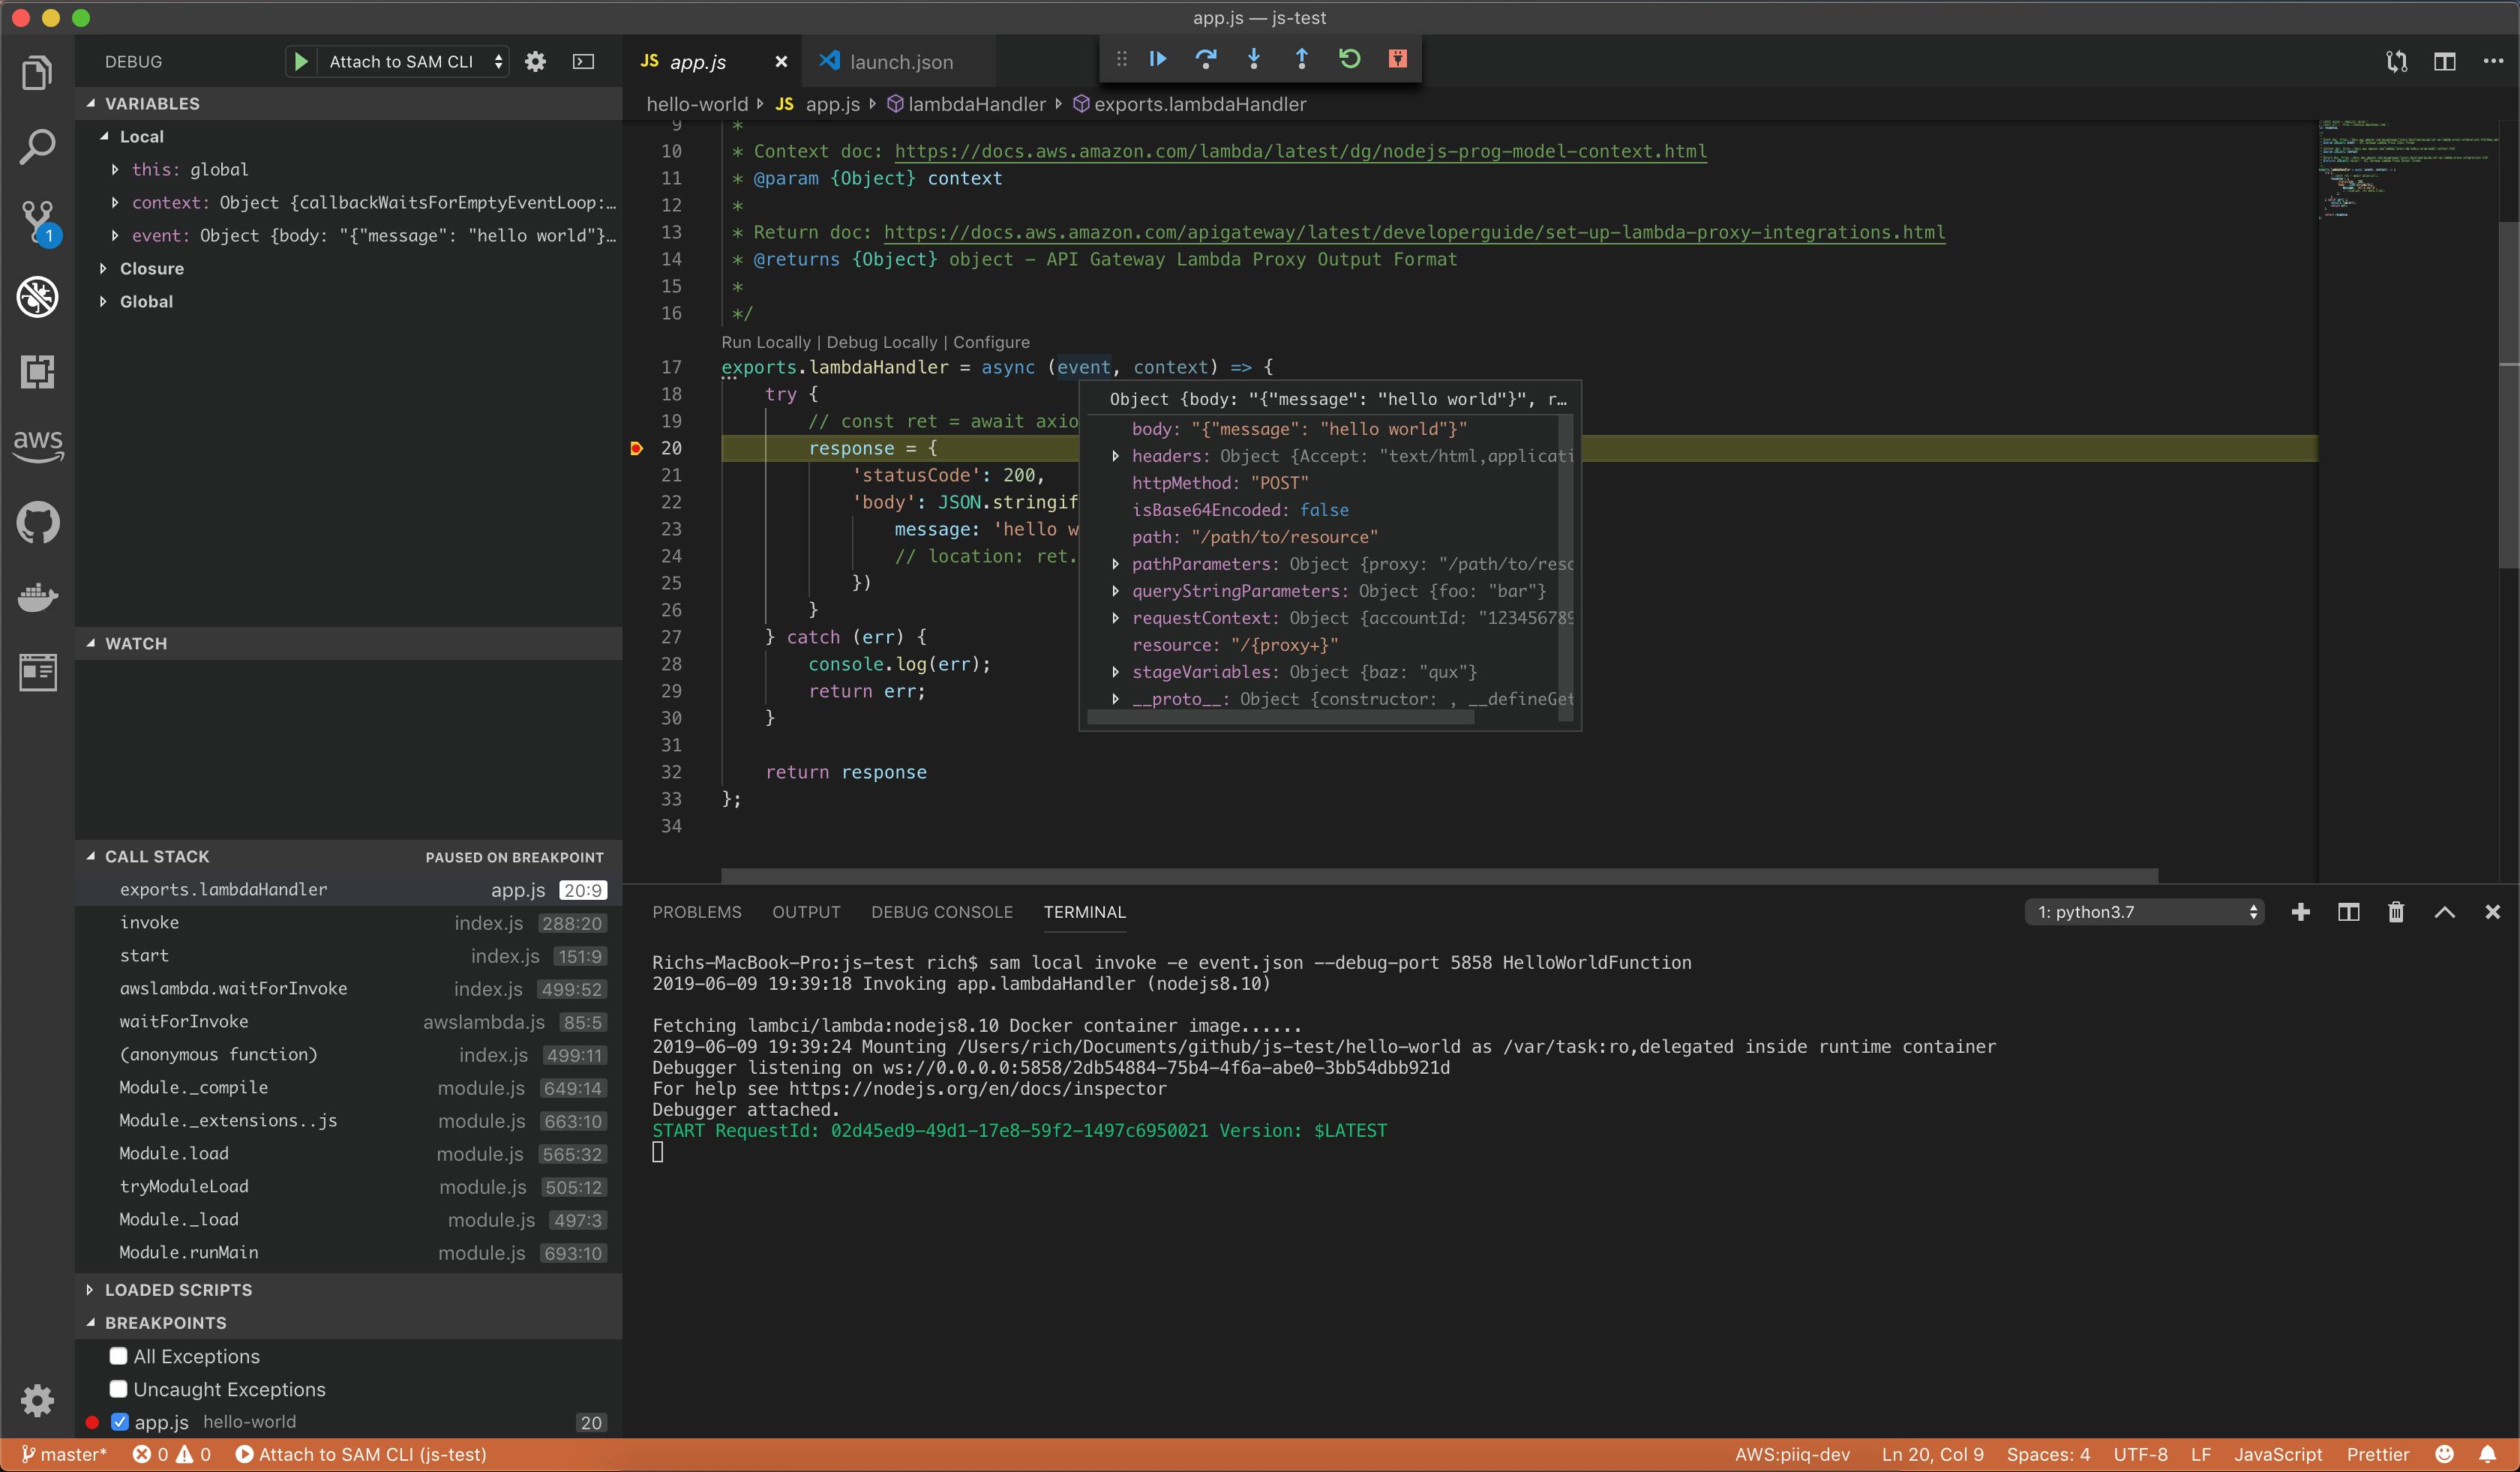
In the screenshot above I've already setup a break point on one of the lines and VS code shows the Lambda waiting at that line correctly. From here you can step through your function and view the value for variables by holding your mouse over the variable name.
You can also use the -d 5858 with SAM local API to add debugging to your API calls.
sam local start-api -d 5858